
Part 1 of 2. This one is about the shows. Next week is about the songs.
Somewhere in the early 90s, the remote control became the villain. A full minute of theme song is a full minute for your thumb to wander. In the summer of 1994, ABC’s entertainment president, Ted Harbert, told Variety he was asking producers to drop the traditional opening titles from new shows. He called them “an antiquated practice.” He also admitted the research behind that was inconclusive, which is my favorite part.
So I wanted to know: did the theme song ever matter? Did a great opening make a great show, or did a great show make us remember the opening? Before I could answer that, I had to answer a more boring question. Which sitcoms actually owned prime time? That’s this post.

The rules
Who made the cut
More 90s sitcoms cracked a top 30. The cut kept the same share of each.

I kept it to scripted sitcoms on the broadcast networks between 8 and 10 p.m. Eastern. That’s ABC, CBS and NBC, plus Fox from 1987 and The WB and UPN from 1995. The 80s run from the 1980–81 season through 1989–90, and the 90s from 1990–91 through 1999–2000.
Shows that straddle two decades were the headache. I gave each one to the decade of its first real season, meaning its first season of 13 or more episodes. That makes Seinfeld a 90s show, which it obviously is. Its 1989–90 “season” was a four-episode tryout. Wings goes to the 90s too.
Nielsen’s published season rankings only go 30 deep, so my pool is every qualifying sitcom that cracked a season’s top 30 at least once. That’s 35 sitcoms from the 80s and 47 from the 90s. From each pool I kept the top 20% by best single season: 7 shows from the 80s and 10 from the 90s. Twenty percent of 47 is 9.4, which rounds to 9, but The Single Guy and Room for Two tied at a 16.7 for the last spot, so both stay.
One honest gap. A few of the old 80s lists I worked from were cut off at the bottom, so a couple of low-ranked 80s shows may be missing from the pool. Nobody missing would outrank the seven that made it.
The 80s: Thursday on NBC was the whole country’s living room
The top 20%, by best season
Five of the seven 80s shows peaked in the same season.

Six of the seven 80s shows were on NBC, and five of them peaked in the same season, 1986–87. That season, NBC sitcoms held five of the top seven spots in all of prime time, not just among sitcoms: The Cosby Show at #1, Family Ties at #2, Cheers at #3, The Golden Girls at #5 and Night Court at #7. Four of those aired on the same night, Thursday, back to back.
I know it’s unpopular to say these days, but I loved The Cosby Show
The top of the 80s list also has a tie. In 1989–90, Roseanne and The Cosby Show tied for #1 with a 23.1. Roseanne only had two seasons inside the 80s and still made the cut.
The 90s: three anchors and the neighbors
Same shows, by best rank
On rank, the two decades look a lot alike.
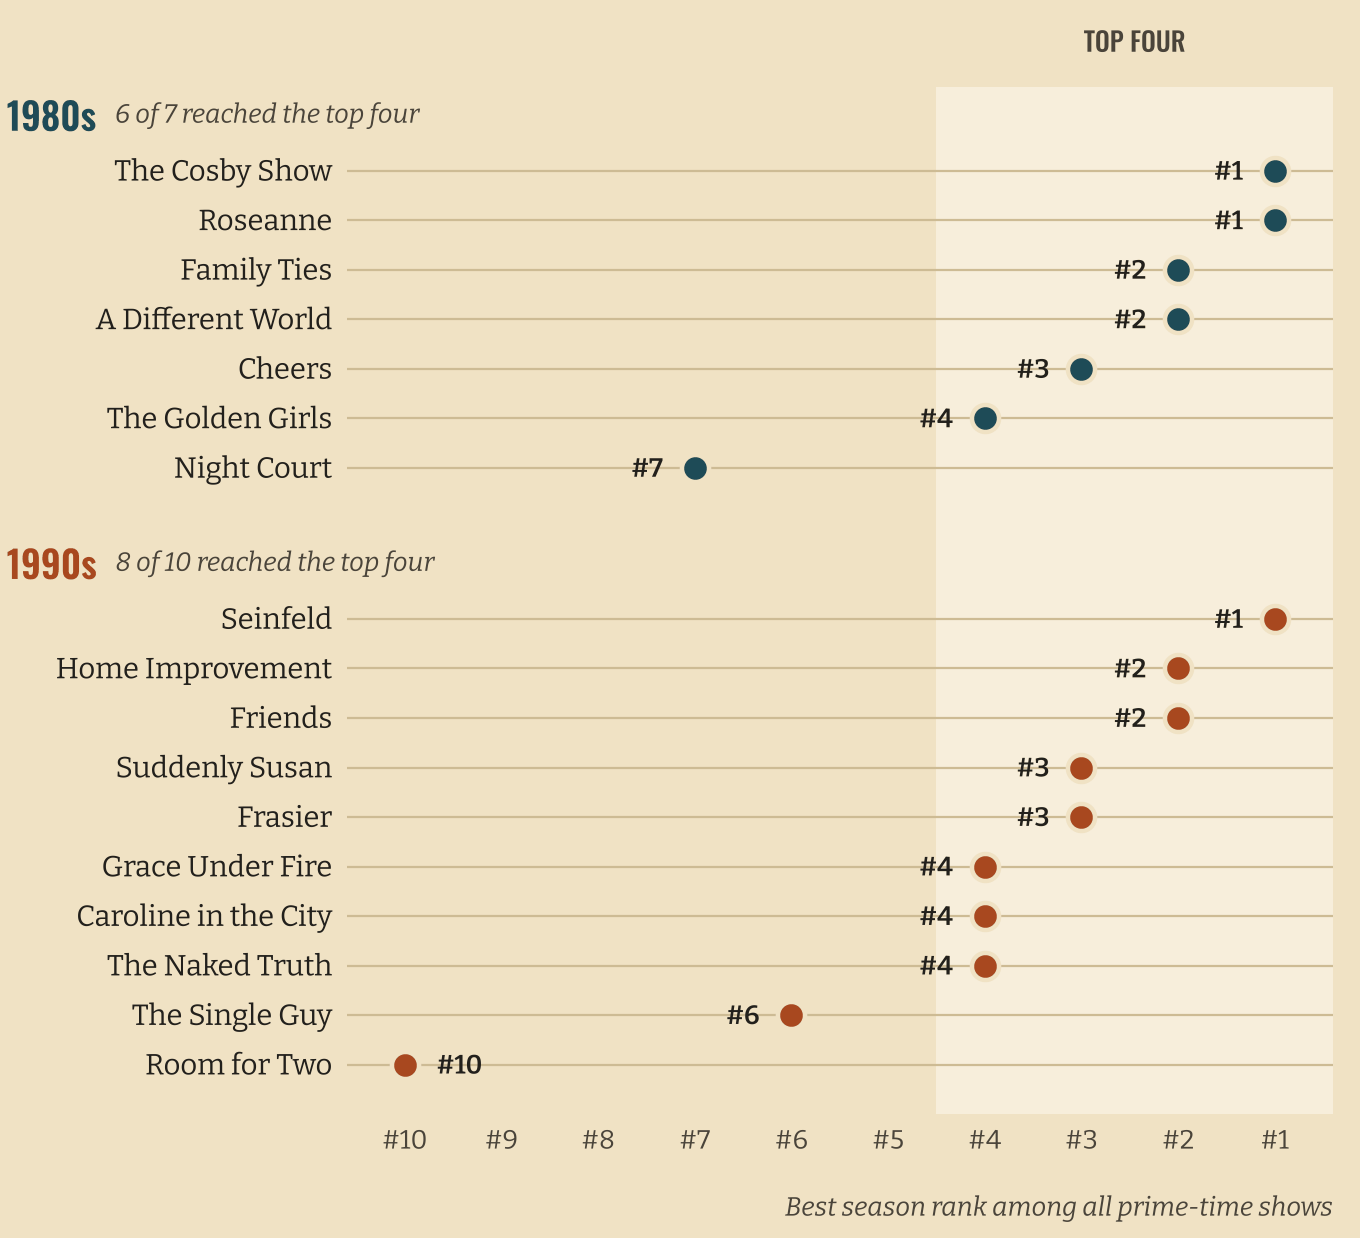
The 90s list starts where you’d expect: Seinfeld, Home Improvement, Friends. Then it gets interesting. Grace Under Fire, Caroline in the City, Suddenly Susan, Frasier, The Naked Truth, The Single Guy and Room for Two round out the ten.
Real estate explains a lot of that. The Single Guy sat between Friends and Seinfeld. Caroline in the City and Suddenly Susan each held the 9:30 slot right after Seinfeld. Room for Two followed Roseanne. Seven of the ten spent time on NBC’s Thursday night. Think of a strip mall: the anchor stores bring the traffic, and the shop wedged between them does great business for a couple of years.
Now look at rank instead of rating. Six of the seven 80s shows reached the top four in at least one season. Eight of the ten 90s shows did too. On rank, the elites of both decades look like the same club.
Two near misses, since somebody will ask. Veronica’s Closet missed the 90s cut by one-tenth of a rating point, with a 16.6 and a #3 finish in 1997–98. Everybody Loves Raymond didn’t come close inside the 90s. Its best 90s season was an 11.4 at #12, and its giant years came after 2000.
Points vs. people
Homes, not points
Two #1 shows, eleven seasons apart.

Here’s where I had to fix my own thinking. The 80s shows were bigger. Actually, no, that’s not right. The 80s shows had bigger ratings, and that isn’t the same thing. A rating is a percentage, the share of all TV homes tuned in, and the number of TV homes kept growing.
The Cosby Show was #1 in 1986–87 with a 34.9. That was about 30.5 million homes out of 87.4 million with a TV. Seinfeld was #1 in 1997–98 with a 21.7, about 21.3 million homes out of 98.0 million. Both were #1.
Between those two seasons, the country added 10.6 million TV homes, and the #1 show reached 9.2 million fewer of them. Cable cut into the networks’ share, so 90s ratings ran lower across the board, even for the hits. A percentage is only as honest as the thing it’s a percentage of. From here on, I lean on rank.
The hand-off
Ratings, season by season
Cheers hands off to Seinfeld, and nobody gets back to 1986–87.
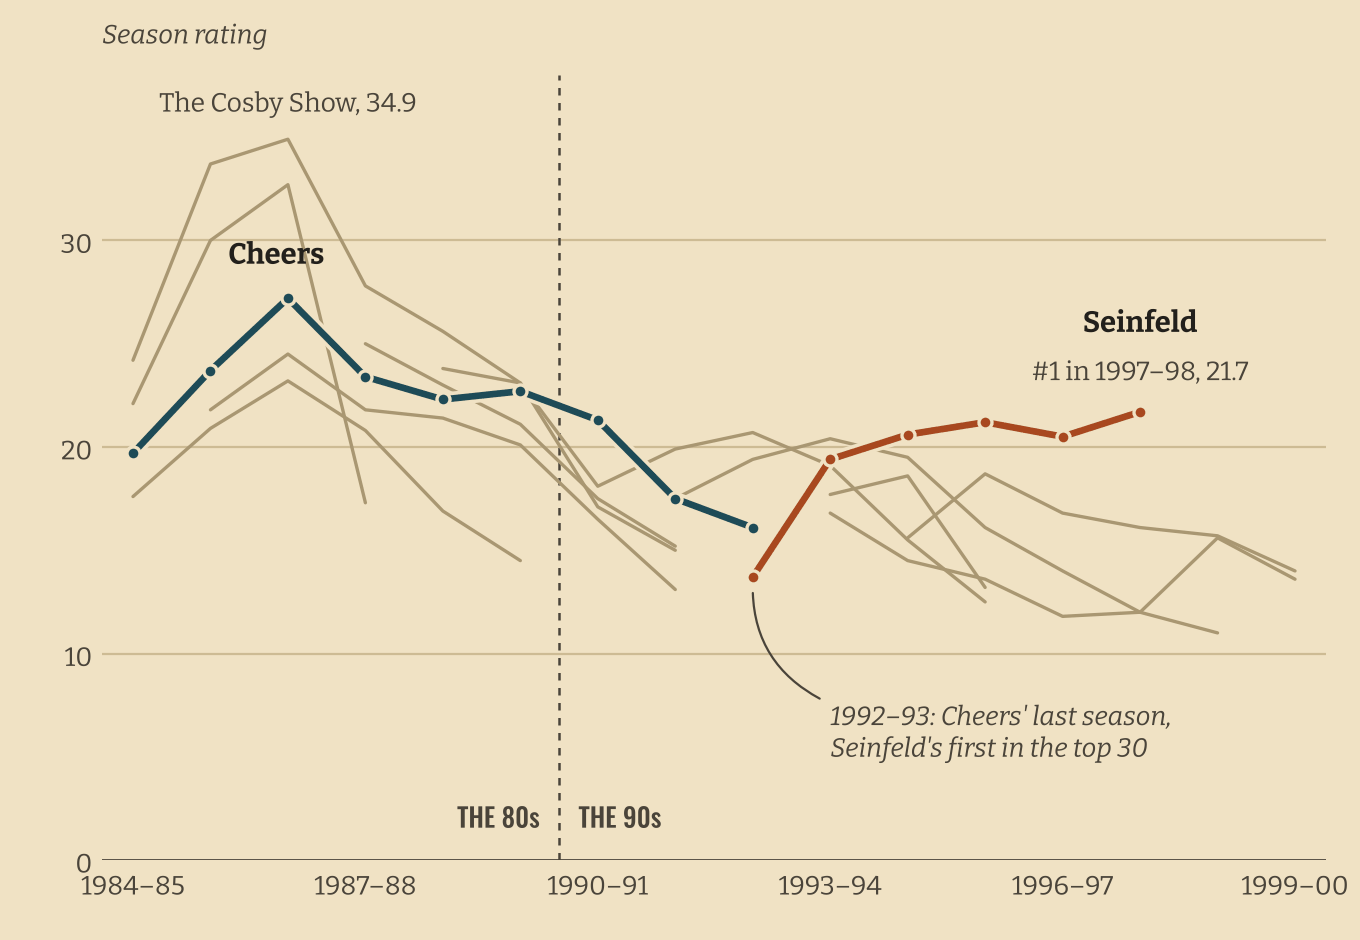
Two lines tell the story. Cheers peaked with a 27.2 in 1986–87 and eased down from there. Its last season, 1992–93, was Seinfeld’s first in the top 30. Seinfeld ended up in Cheers’ old Thursday 9:00 slot and finished its final season, 1997–98, at #1 with a 21.7.
No season in the 90s on this chart beat that 21.7. In 1986–87 alone, five 80s shows did. Two things are true at once: the 80s had the bigger crowds, and the 90s had the same kind of dominance over a smaller slice of a bigger country.

.jpg)
Next week: the music
That’s the field. Seventeen shows, two decades and one very crowded Thursday. Next week I get to the question I actually started with: did a great theme song make a great show? I built a catchiness score to find out, and the scatterplot did not cooperate.
Notes and sources. Ratings are Nielsen household ratings for each regular season. Small samples: 7 shows and 10 shows.
Leave a Reply